Statistical Software Quality Assurance
In software engineering, Statistical Software Quality Assurance (SSQA) is a powerful approach that applies statistical methods to assess and improve the quality of software products and processes. Unlike traditional quality assurance that might focus on adherence to standards, SSQA delves into quantitative analysis of defect data. Its primary goal is to identify the root causes of software errors, understand recurring patterns, and then use these insights to guide continuous process improvement. By leveraging statistical analysis, SSQA helps organizations make data-driven decisions to enhance software quality, reduce defect rates, and optimize development efforts.
The Core Idea of SSQA
The fundamental premise of Statistical Software Quality Assurance is that software defects are not random occurrences. Instead, they often result from systemic issues within the development process. By collecting and analyzing data on defects (e.g., when they occurred, where they were found, their type, and their severity), SSQA aims to:
- Identify Root Causes: Pinpoint the underlying reasons why defects are being introduced.
- Predict Defect Trends: Forecast future defect rates or identify areas prone to errors.
- Guide Process Improvement: Recommend specific changes to the development process that will prevent similar defects from occurring in the future.
- Establish Baselines: Provide quantitative benchmarks for software quality, allowing for objective measurement of improvements over time.
SSQA Activities and Techniques
Statistical Software Quality Assurance involves a set of structured activities and employs various statistical techniques to achieve its objectives:
1. Defect Data Collection and Categorization
The first step is to systematically collect data on all identified software defects. This data typically includes:
- Type of defect: e.g., logic error, syntax error, requirements misunderstanding, interface error.
- Origin of defect: e.g., requirements phase, design phase, coding phase.
- Severity of defect: e.g., critical, major, minor.
- Time of discovery: When the defect was found.
- Cost to fix: The effort required to correct the defect.
Defects are then categorized to allow for meaningful analysis.
2. Cause Analysis
Once data is collected, statistical tools are used to analyze it and identify the most significant sources of defects. Common techniques for cause analysis in SSQA include:
- Pareto Analysis (80/20 Rule): This technique helps identify the “vital few” causes that contribute to the “trivial many” defects. For example, it might show that 80% of defects originate from only 20% of the possible causes (e.g., unclear requirements or specific coding practices). By focusing efforts on these few critical causes, significant improvements can be achieved.
- Cause-and-Effect Diagrams (Fishbone Diagrams): These diagrams help visualize potential causes for a specific defect or problem, organizing them into categories like people, process, environment, and tools.
- Scatter Diagrams: Used to explore the relationship between two variables, such as lines of code and number of defects.
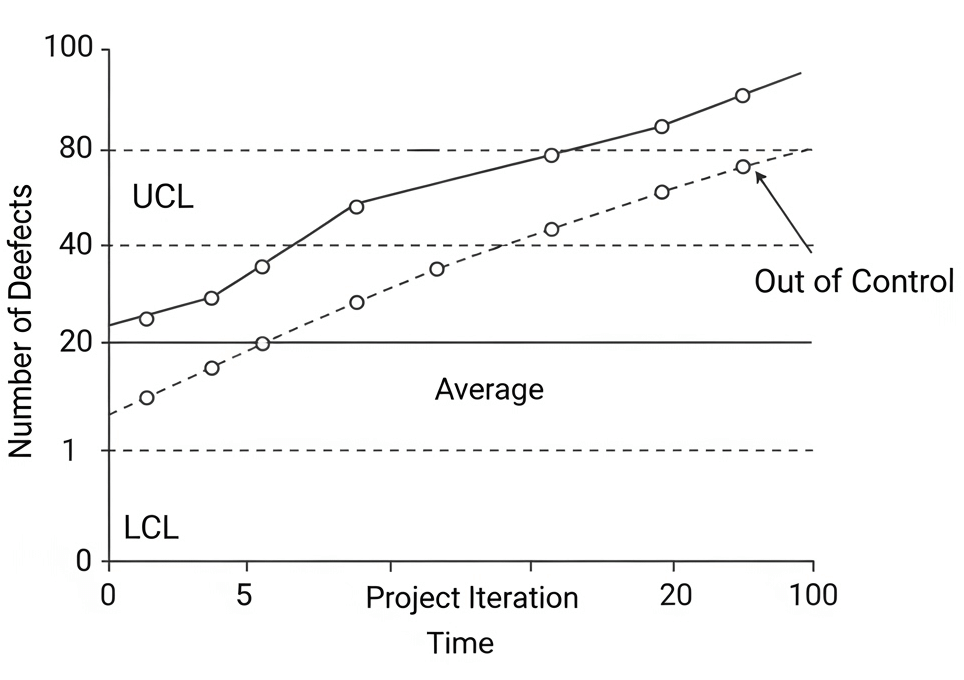
3. Process Monitoring and Control Charts
Control charts are a key statistical tool in SSQA for monitoring the software process over time. They help determine if a process is stable and operating within acceptable limits, or if it is “out of control” due to a special cause variation.
- Purpose: To monitor process stability and identify unusual patterns or trends in defect rates.
- Mechanism: Data points (e.g., number of defects per module, defect density) are plotted over time, along with upper and lower control limits.
- Interpretation: If a data point falls outside the control limits, or if there’s a non-random pattern, it signals a process problem that needs investigation and correction.
This continuous monitoring allows for timely intervention and prevents quality issues from escalating.
4. Process Improvement
Based on the insights gained from defect analysis and process monitoring, specific recommendations for process improvement are formulated. These improvements aim to eliminate the root causes of defects, leading to a more efficient and higher-quality development process. Examples might include:
- Enhanced training programs.
- Refined coding standards.
- More rigorous review procedures.
- Better communication protocols.
Benefits of Statistical Software Quality Assurance
Implementing Statistical Software Quality Assurance provides significant advantages for software development organizations:
- Data-Driven Decisions: Moves quality management from subjective opinions to objective, measurable facts.
- Targeted Improvements: Identifies the most impactful areas for process changes, leading to more efficient resource allocation.
- Reduced Defect Rates: By addressing root causes, SSQA helps reduce the overall number of defects in software.
- Cost Savings: Preventing defects and optimizing processes lead to substantial reductions in rework, testing, and maintenance costs.
- Increased Predictability: A more stable and controlled process results in more predictable project schedules and quality outcomes.
- Continuous Learning: Fosters a culture of continuous learning and improvement based on empirical data.
Conclusion
Statistical Software Quality Assurance (SSQA) is a vital component of modern software quality management. By systematically applying statistical methods to defect data, SSQA provides profound insights into the underlying causes of software problems. This data-driven approach, utilizing tools like Pareto analysis and control charts, enables organizations to identify key areas for process improvement, ultimately leading to reduced defect rates, enhanced software reliability, and more efficient development cycles. Embracing SSQA empowers teams to build higher-quality software with greater predictability and confidence.