Risk Projection
Following the identification of various potential threats, the next crucial step in effective risk management is risk projection, often called risk estimation. This phase involves assessing both the likelihood of each identified risk occurring and the potential consequences or impact if it does materialize. Essentially, risk projection helps to quantify the risk, allowing project managers to prioritize which risks demand the most immediate attention and resources. By understanding both the probability and the severity of a risk, teams can make more informed decisions about how to mitigate or avoid these potential problems, ensuring smoother project progression.
Steps in Risk Projection
Risk projection typically follows a structured series of steps to systematically evaluate each identified risk. This ensures consistency and thoroughness in the assessment process.
Step 1: Establish a Scale for Probability
The first step involves defining a clear scale to measure the probability of a risk actually occurring. This scale can be qualitative, using terms like “low,” “medium,” or “high,” or it can be more quantitative, such as a percentage from 1% to 100%. For instance, probabilities can be assigned numerical values for greater precision:
- Very Low: 10% (0.1)
- Low: 30% (0.3)
- Moderate: 50% (0.5)
- High: 70% (0.7)
- Very High: 90% (0.9)
Using such a defined scale ensures consistency when evaluating different risks, thus improving the objectivity of the assessment.
Step 2: Establish a Scale for Impact
Similarly, a scale must be established to measure the potential impact or consequences of a risk if it occurs. This impact generally considers effects on project cost, schedule, overall performance, and product support. Like probability, impact can be rated qualitatively or quantitatively. For example, impact levels can be clearly defined as:
- Catastrophic (5): This signifies an unacceptable delay, a major increase in cost, or severe performance degradation.
- Critical (4): This indicates a significant delay, a moderate cost increase, or a noticeable performance degradation.
- Marginal (3): This suggests a minor delay, a slight cost increase, or minimal performance impact.
- Negligible (2): This implies little to no noticeable impact on the project or product.
Step 3: Assess Each Risk
Once the scales are defined, each identified risk must be assessed individually for both its probability of occurrence and its potential impact. This assessment typically relies on expert judgment, available historical data from similar projects, and sometimes more formal risk analysis techniques. This step requires careful consideration of all relevant factors.
Step 4: Determine the Overall Risk Exposure
The final and crucial step in risk projection is to calculate the overall risk exposure (RE) for each risk. Risk exposure is determined by multiplying the probability of the risk by its impact or the potential cost if the risk materializes.
Where:
- P = Probability of the risk occurring (as a decimal).
- I = Impact or cost of the risk if it occurs (as a numerical value from the impact scale).
For example, if a risk has a probability of 0.7 (High) and an impact value of 4 (Critical), its risk exposure would be calculated as . Consequently, risks with higher calculated risk exposure values are considered more critical and require more immediate attention and planning.
Risk Table
A risk table serves as a practical and organized tool in risk projection. It is used to systematically list and visualize the results of the risk assessment. Such a table typically includes each risk, its category, the assessed probability, the estimated impact, and the calculated risk exposure. This structured presentation enables project managers to quickly review all identified risks and prioritize them effectively based on their calculated exposure.
Example Risk Table Structure:
| Risk | Category | Probability (P) | Impact (I) | Risk Exposure (RE = P x I) |
|---|---|---|---|---|
| Staff turnover | Project | High (0.7) | Critical (4) | 2.8 |
| Unclear requirements | Technical | Moderate (0.5) | Catastrophic (5) | 2.5 |
| Budget overrun | Project | Low (0.3) | Critical (4) | 1.2 |
This table provides a clear, at-a-glance view of the most significant risks facing the project, thereby facilitating better decision-making.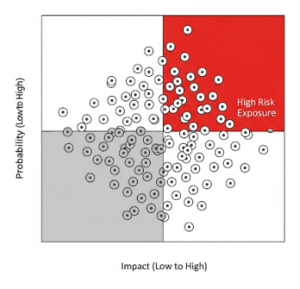
Conclusion
Risk projection is a vital analytical phase in the comprehensive risk management process. By systematically assessing the probability and potential impact of each identified risk, and by calculating its overall risk exposure, project teams gain a quantitative understanding of the most critical threats. This allows for informed prioritization, ensuring that limited resources are effectively directed towards addressing the most significant risks. Consequently, robust risk projection empowers project managers to proactively develop strategies that minimize adverse effects, thereby helping to keep software development projects on schedule, within budget, and successful.