Introduction to The Art of Debugging
Debugging is a critical, often intricate, process in software engineering focused on identifying, analyzing, and ultimately removing defects, commonly known as “bugs,” from software. It is frequently referred to as “the art of debugging” because it demands a combination of systematic investigation, intuitive problem-solving, and creative thinking. While software testing reveals the presence of bugs by executing the application, debugging dives deeper to pinpoint the exact location and root cause of those identified issues. This process is iterative, involving the reproduction of the bug, isolation of the fault, analysis of the cause, and verification of the fix.
Understanding Software Bugs
A software bug is an error, flaw, failure, or fault in a computer program or system that causes it to produce an incorrect or unexpected result, or to behave in unintended ways. These defects can arise from various sources, including logical errors, syntax errors, integration issues, or incorrect assumptions made during design or coding.
The Debugging Process: An Iterative Approach
Debugging is not a one-time activity but rather an iterative cycle that typically involves the following steps: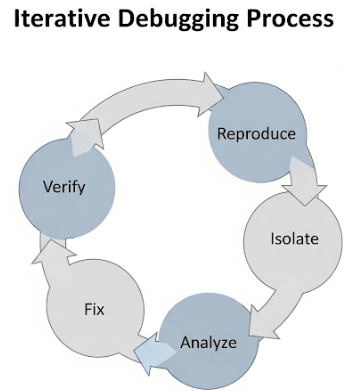
- Bug Reproduction: The first crucial step is to reliably reproduce the bug. This involves understanding the exact sequence of actions or conditions that trigger the defect. Without consistent reproduction, identifying the cause becomes exceedingly difficult.
- Fault Isolation: Once reproducible, the next step is to isolate the part of the code or system that is causing the fault. This might involve techniques like stepping through code, printing variable values, or narrowing down the scope of the problem.
- Cause Analysis: After isolation, the developer analyzes the code and its execution flow to understand why the fault is occurring. This often requires deep understanding of the program’s logic, data flow, and interactions with other components.
- Fixing the Defect: Once the root cause is identified, a solution is implemented to correct the defect.
- Verification of Fix: The final step is to re-test the software to ensure that the bug has indeed been fixed and that no new defects have been introduced (regression testing). This confirms the effectiveness of the debugging effort.
Challenges in The Art of Debugging
Debugging, especially in complex software systems, presents several inherent challenges that contribute to its “artistic” nature:
- Complexity of Software: Modern software applications are highly intricate, comprising numerous interconnected modules, vast lines of code, and complex interactions. Consequently, tracing a bug through such a labyrinthine structure can be immensely difficult, making precise fault localization challenging.
- Difficulty in Reproduction: Some bugs are intermittent or manifest only under specific, rare conditions, making them extremely hard to reproduce consistently. Unless a bug can be reliably triggered, diagnosing its root cause becomes nearly impossible, consequently slowing down the resolution process.
- Diagnosis Difficulty: Often, bugs are not isolated to a single line of code but instead stem from subtle interactions between different components, threads, or external systems. This intricate web of dependencies means that identifying the true underlying cause of a problem can be a significant diagnostic challenge.
- Difficulty in Fixing: More fundamentally, certain bugs may reveal deep-seated design flaws or architectural issues within the software system. Such problems are inherently difficult to fix and might necessitate substantial changes or even a complete refactoring of significant parts of the software, proving both time-consuming and expensive to rectify.
Debugging Tools and Techniques
Developers often use various tools and techniques to aid in the debugging process:
- Debuggers: Integrated Development Environments (IDEs) provide debuggers that allow developers to step through code line by line, inspect variable values, set breakpoints, and examine the program’s state at runtime.
- Logging: Inserting print statements or using logging frameworks to output information about program execution, variable values, and error messages can help trace the flow of execution.
- Stack Traces: When an error occurs, a stack trace provides a detailed report of the sequence of function calls that led to the error, helping to identify the point of failure.
- Version Control History: Reviewing changes in the code repository can help identify when and where a bug might have been introduced.
- Unit Tests: Well-written unit tests can act as small, specific reproduction cases for bugs, making it easier to isolate issues.