Introduction to Product Metrics
Product metrics are quantitative measures used to characterize and evaluate various attributes of a software product. They offer objective insights into the quality, complexity, efficiency, and overall characteristics of the software itself. By collecting and analyzing these metrics, software development teams can gain a clearer understanding of the product’s status, track progress, identify potential issues early, and make data-driven decisions throughout the software development lifecycle. These metrics are crucial for ensuring the delivery of high-quality software that effectively meets its intended objectives.
Software Quality
Software quality is a paramount aspect of product metrics. It refers to the degree to which a software product meets its specified requirements and satisfies the implicit or explicit needs of its users. High software quality implies that the software is reliable, performs efficiently, is easy to use, and is adaptable to future changes.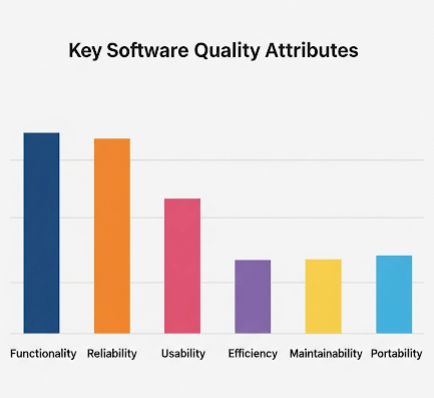
Key Software Quality Attributes:
- Functionality: The extent to which the software provides functions that satisfy stated and implied needs when used under specified conditions. It’s about what the software does.
- Reliability: The ability of the software to perform its required functions consistently under specified conditions for a defined period without failure. It indicates the software’s dependability.
- Usability: The ease with which users can learn to use the software, operate it effectively, and achieve their goals. This includes aspects like user interface design and intuitive navigation.
- Efficiency: The amount of computing resources (e.g., CPU, memory, disk I/O, network bandwidth) and time required by the software to perform its functions.
- Maintainability: The ease with which the software can be modified to correct faults, improve performance or other attributes, or adapt to a changed environment. This includes corrective, adaptive, and perfective maintenance.
- Portability: The ease with which the software can be transferred from one hardware or software environment to another. This is crucial for cross-platform compatibility.
Metrics for the Analysis Model
Metrics applied during the analysis model phase primarily focus on the quality and complexity of the software requirements and the initial understanding of the system. These metrics serve as early indicators, helping to identify potential issues before design and coding commence.
Examples of Analysis Model Metrics:
- Function Point (FP) Metric: A widely recognized metric that quantifies the functionality delivered by a software system from the user’s perspective. It measures the amount of business functionality in an information system. Function points are derived by counting external inputs, external outputs, external inquiries, internal logical files, and external interface files, and then weighting them by their complexity. This metric is valuable for estimating project size, effort, and cost early in the development cycle.
- Information Flow Metrics: These metrics analyze the flow of information between different entities or functions as defined in the requirements and analysis model. They can help in understanding dependencies and potential bottlenecks.
- Data Structure Metrics: These evaluate the complexity and relationships of data elements within the proposed system’s data structures. They help in assessing the clarity and integrity of the data model.
Metrics for the Design Model
Metrics for the design model are used to assess the quality of the software design before implementation. They help in evaluating design characteristics such as modularity, coupling, and cohesion, which are critical for building maintainable and robust software. Identifying design flaws at this stage is more cost-effective than finding them during coding or testing.
Examples of Design Model Metrics:
- Coupling: Measures the degree of interdependence between different software modules. A lower degree of coupling is generally preferred because it means modules are more independent, making them easier to understand, test, and modify without affecting other parts of the system.
- Cohesion: Measures the degree to which elements within a single module belong together. High cohesion is desirable, as it indicates that a module is focused on performing a single, well-defined task or set of closely related tasks, improving its understandability and reusability.
- Complexity Metrics: While often applied to code, structural complexity can also be assessed at the design level. For example, by analyzing flowcharts or design diagrams, one can infer the potential complexity of the resulting code. High complexity in design might suggest areas prone to errors during implementation.
- Fan-in/Fan-out: These metrics quantify the number of modules that call a given module (fan-in) and the number of modules called by a given module (fan-out). High fan-out can indicate a module that is overly dependent on others, while high fan-in might point to a highly utilized but potentially fragile module if it’s not robustly designed.
Metrics for Source Code
Metrics for source code are applied after the coding phase to quantitatively assess the characteristics of the actual written code. These metrics provide insights into the code’s complexity, readability, size, and maintainability, directly impacting the effort required for debugging and future modifications.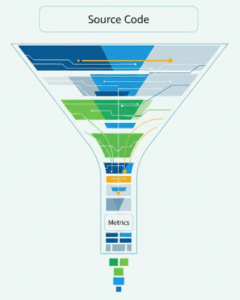
Examples of Source Code Metrics:
- Lines of Code (LOC): A straightforward metric that counts the number of physical lines of code in a program. While simple to measure, its effectiveness as a sole indicator of complexity or effort is limited, as it doesn’t account for code quality or density.
- Cyclomatic Complexity: This metric quantifies the complexity of a program’s control flow graph. It measures the number of linearly independent paths through a program’s source code. Higher cyclomatic complexity often correlates with more complex logic, which can lead to more defects and increased maintenance difficulty.
- Comment Percentage: The ratio of lines of comments to the total lines of code. A higher percentage of meaningful comments often indicates better code readability and documentation, which is vital for maintainability and collaboration.
- Halstead’s Software Science Metrics: These metrics are derived from the number of unique operators, total operators, unique operands, and total operands in a program’s code. They can be used to estimate program length, vocabulary, volume, and effort required for implementation.
- Code Duplication: Measures the extent of redundant or copied code segments within a software system. High code duplication can lead to increased maintenance effort, potential inconsistencies when changes are made, and larger code bases.
Metrics for Testing
Metrics for testing are used to evaluate the efficiency and effectiveness of the testing process itself, as well as the quality of the software from a testing perspective. These metrics help in understanding how well testing activities are identifying and preventing defects.
Examples of Testing Metrics:
- Defect Density: Measures the number of defects found per unit of code (e.g., defects per thousand lines of code – KLOC, or per function point). A lower defect density is generally desirable.
- Defect Removal Efficiency (DRE): This metric assesses the effectiveness of the defect detection process. It calculates the percentage of defects found before software release compared to the total number of defects found (both before and after release). A higher DRE indicates a more efficient testing process.
- Test Coverage: Measures the percentage of code (e.g., statements, branches, paths) that has been executed by test cases. Higher test coverage generally implies more thorough testing.
- Number of Bugs Found/Reported: A basic count of the total defects identified during testing. This can be categorized by severity or priority.
- Test Case Execution Rate: The number of test cases executed per unit of time (e.g., per day or hour), indicating the speed of test execution.
- Retest Pass Rate: The percentage of previously failed test cases (due to bugs) that pass after a bug fix has been implemented and retested. A high retest pass rate indicates effective bug fixing.
Metrics for Maintenance
Metrics for maintenance focus on the effort, cost, and effectiveness of maintaining the software after it has been deployed. These metrics are crucial for understanding the long-term cost of ownership and the ease with which the software can be adapted, corrected, or enhanced over time.
Examples of Maintenance Metrics:
- Mean Time To Change (MTTC): The average time taken to implement a change request, which could be a bug fix, an enhancement, or an adaptation. A shorter MTTC indicates better maintainability.
- Number of Change Requests (CRs): A count of all modification requests received from users or stakeholders post-deployment. A high number could indicate instability or evolving requirements.
- Cost of Maintenance: The financial resources spent on maintenance activities over a period, including corrective, adaptive, and perfective maintenance. This helps in budgeting and resource allocation for ongoing support.
- Number of Production Defects: Defects reported by users or detected in the live production environment. A high number suggests that the quality assurance process was not fully effective before release.
- Maintainability Index: A complex metric often calculated from other code metrics (like cyclomatic complexity and lines of code) that provides a single value indicating how easy it is to maintain the software. A higher index suggests better maintainability.
- Defect Fix Rate: The rate at which reported defects are resolved and closed. This reflects the efficiency of the maintenance team in addressing issues.