Introduction to Metrics for Testing
During the software development lifecycle, particularly in the quality assurance phase, it is vital to assess how effectively testing activities are uncovering and preventing defects. Metrics for testing are quantitative measures used to evaluate the efficiency and effectiveness of the software testing process itself, as well as the quality of the software from a testing perspective. These metrics provide objective data that helps teams understand the progress of testing, the thoroughness of test coverage, and the overall reliability of the software before its release. Ultimately, leveraging testing metrics enables data-driven decisions to optimize the testing process and enhance product quality.
Importance of Testing Metrics
Applying metrics to the testing phase offers several significant benefits:
- Process Improvement: Provides insights into the effectiveness of current testing strategies and methodologies, facilitating continuous improvement.
- Quality Indicators: Offers concrete data about the quality status of the software under test, helping to gauge readiness for release.
- Resource Management: Aids in better allocation of testing resources and effort by highlighting areas requiring more attention.
- Risk Management: Helps in identifying high-risk areas in the software based on defect trends and test coverage.
- Decision Support: Provides objective data for management decisions regarding release schedules, retesting, and bug prioritization.
Key Metrics for Testing
Various types of metrics are used to evaluate the testing process and its outcomes. Each metric offers a unique perspective on the efficiency and effectiveness of the quality assurance efforts.
Defect Density
Defect density is a crucial metric for testing that measures the number of defects found per unit of code. It is commonly expressed as defects per thousand lines of code (KLOC) or defects per function point. A lower defect density generally indicates higher software quality and more effective development and testing processes. This metric helps in identifying modules or components that are particularly prone to bugs, allowing teams to focus retesting or refactoring efforts. Furthermore, it serves as an important indicator for gauging the cleanliness of the codebase.
Defect Removal Efficiency (DRE)
Defect Removal Efficiency (DRE) is a powerful metric for assessing the effectiveness of the defect detection process. It calculates the percentage of defects found before software release compared to the total number of defects found (both before and after release). The formula for DRE is:

A higher DRE indicates a more efficient testing process that successfully identifies and removes a large proportion of defects before the software reaches end-users. This metric is a direct measure of test effectiveness.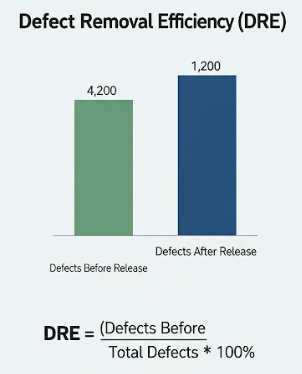
Test Coverage
Test coverage measures the percentage of code that has been executed by test cases. It assesses the thoroughness of the testing effort. Various types of test coverage exist, including:
- Statement Coverage: Percentage of executable statements covered.
- Branch Coverage: Percentage of decision branches (e.g., if/else) covered.
- Path Coverage: Percentage of independent execution paths covered.
Higher test coverage generally implies more comprehensive testing, which reduces the likelihood of undiscovered defects. Tools can automate the measurement of test coverage, providing objective data on testing completeness.
Number of Bugs Found/Reported
This is a basic, yet essential, metric for testing: a simple count of the total defects identified during the testing phase. While straightforward, this metric can be further categorized by:
- Severity: (e.g., critical, major, minor)
- Priority: (e.g., high, medium, low)
- Module: To identify problematic areas.
Analyzing the trend of bugs found over time can indicate the stability of the software or the effectiveness of recent changes.
Test Case Execution Rate
Test case execution rate measures the number of test cases executed per unit of time (e.g., per day or per hour). This metric provides an indication of the speed and efficiency of the test execution phase. It helps teams track progress and manage resources allocated to testing activities. A consistent or increasing execution rate can suggest efficient test operations.
Retest Pass Rate
The retest pass rate is a crucial metric that evaluates the effectiveness of bug fixing and subsequent retesting. It is calculated as the percentage of previously failed test cases (due to identified bugs) that pass successfully after a bug fix has been implemented and retested. A high retest pass rate indicates that bug fixes are generally effective and that the retesting process confirms these fixes without introducing new regressions. Conversely, a low pass rate might suggest incomplete fixes or new regressions.
Conclusion
Metrics for testing are indispensable for gauging the health of the software product and the efficacy of the quality assurance process. By diligently tracking measures such as defect density, defect removal efficiency, and test coverage, teams gain objective insights into where the software stands regarding quality and how well the testing efforts are performing. These metrics consequently empower project managers and testers to make informed decisions, optimize resources, and ultimately deliver a higher quality software product to the end-users.