Introduction to Metrics for Maintenance
After software deployment, the product enters its maintenance phase, which can extend for many years. Metrics for maintenance are crucial quantitative measures used to evaluate the effort, cost, and overall effectiveness of maintaining the software. These metrics provide vital insights into the long-term viability and cost of ownership of the software product. By tracking how effectively defects are resolved, how efficiently changes are implemented, and the resources consumed, organizations can optimize their maintenance strategies, improve software longevity, and ensure continued user satisfaction.
Importance of Maintenance Metrics
Applying metrics specifically to the maintenance phase offers several significant benefits:
- Cost Management: Provides data on the actual cost of supporting and evolving the software, aiding in budgeting and resource allocation.
- Predictability: Helps in forecasting future maintenance efforts and identifying trends in software stability.
- Process Improvement: Reveals inefficiencies in defect resolution or change implementation processes, leading to improvements.
- Software Health Assessment: Offers insights into the underlying quality of the software as it ages and undergoes modifications.
- Resource Optimization: Guides decisions on where to invest maintenance resources most effectively.
- Strategic Planning: Informs decisions about whether to continue maintaining existing software or to develop new solutions.
Key Metrics for Maintenance
Various types of metrics are used to evaluate the different aspects of software maintenance, from bug fixes to enhancements and adaptations.
Mean Time To Change (MTTC)
Mean Time To Change (MTTC) measures the average time taken to implement a change request from its initiation to its successful deployment. A change request could be a bug fix, an enhancement, or an adaptation to a new environment. A shorter MTTC generally indicates better maintainability and a more efficient maintenance process. This metric helps teams understand their agility in responding to evolving needs and issues.
Number of Change Requests (CRs)
The Number of Change Requests (CRs) is a straightforward count of all modification requests received from users or stakeholders for a software product post-deployment. These requests can include bug reports, requests for new features, or adaptations to new operating environments. A high number of CRs might indicate:
- Underlying instability in the software.
- Evolving or poorly defined initial requirements.
- Frequent changes in the operational environment.
Analyzing CRs by type (e.g., corrective, adaptive, perfective) provides deeper insights into the nature of maintenance work.
Cost of Maintenance
The Cost of Maintenance quantifies the financial resources spent on all maintenance activities over a defined period (e.g., a quarter or a year). This includes labor costs, tool costs, infrastructure, and any other expenses related to keeping the software operational and up-to-date. Understanding this cost is critical for budgeting, assessing the total cost of ownership (TCO), and making informed decisions about whether to invest further in existing software or replace it. This metric is a key indicator of long-term software expense.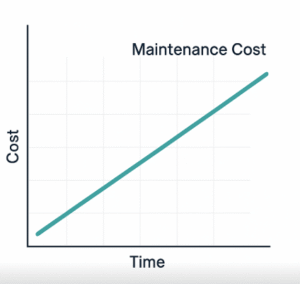
Number of Production Defects
The Number of Production Defects refers to bugs reported by actual end-users or detected in the live production environment after the software has been released. This metric is extremely important because it directly reflects the quality of the software as experienced by the users and the effectiveness of the pre-release quality assurance processes. A high number of production defects suggests that the quality assurance process was not fully effective before release, potentially leading to user dissatisfaction and increased emergency maintenance efforts.
Maintainability Index
The Maintainability Index is a composite metric that provides a single value indicating how easy it is to maintain the software. It is often calculated from other code metrics, such as cyclomatic complexity, lines of code, and lines of comments. A higher Maintainability Index suggests better maintainability, meaning the code is easier to understand, test, and modify. This metric is a valuable indicator for long-term code health and future development efforts. It serves as a strong predictor of potential future maintenance burdens.
Defect Fix Rate
The Defect Fix Rate measures the speed and efficiency with which reported defects are resolved and closed. It can be expressed as the number of defects fixed per unit of time (e.g., per day or week) or the average time taken to fix a defect. A higher defect fix rate reflects the responsiveness and efficiency of the maintenance team in addressing issues, directly impacting user satisfaction and system reliability. It helps in assessing the capacity of the team to handle incoming bug reports.
Conclusion
Metrics for maintenance are indispensable for managing software products throughout their operational life. By diligently tracking key indicators such as Mean Time To Change, the Number of Change Requests, and the Cost of Maintenance, organizations gain comprehensive insights into the long-term viability and financial implications of their software. These metrics enable proactive management, efficient resource allocation, and continuous improvement of both the software and the maintenance processes. Ultimately, a strong focus on maintenance metrics ensures that software remains valuable, reliable, and cost-effective over its entire lifecycle.