Stock Maintenance
Aim: To create a system to perform the Stock maintenance
Procedure(I)Problem Statement
The stock maintenance system must take care of sales information of the company and must analyze the potential of the trade. It maintains the number of items that are added or removed. The sales person initiates this Use case. The sales person is allowed to update information and view the database.
(II)Software Requirements Specification
Introduction
Stock maintenance is an interface between the customer and the salesperson. It aims at improving the efficiency in maintaining the stocks.
Purpose
The entire process of Stock maintenance is done in a manual manner considering the fact that the number of customers for purchase is increasing every year, a maintenance system is essential to meet the demand. So this system uses several programming and database techniques to elucidate the work involved in this process.
Scope
- The System provides an interface to the customer where they can fill in orders for the item needed.
- The sales person is concerned with the issue of items and can use this system.
- Provide a communication platform between the customer and the sales person.
Definitions, acronyms and the abbreviations
- Market Data provider: One who analyze the product and distribute the news.
- Customer: One who takes order of product.
- Salesperson: One who maintains the stock details.
Technologies to be used
- Visual Studio
- VBScript
Tools to be used
- Eclipse IDE (Integrated Development Environment)
- Rational Rose tool (for developing UML Patterns)
Overview
SRS includes two sections overall description and specific requirements. Overall Description will describe major role of the system components and inter-connections. Specific Requirements will describe roles & functions of the actors.
Overall description
The Stock maintenance acts as an interface between the ‘customer’ and the ‘sales person’. This system tries to make the interface as simple as possible and at the same time not risking the work of data stored in.
System functions
- Secure order of information by the customer.
- Schedule the customer an appointment form annual delivery of the product.
User characteristics
- Customer: The person who orders for the item.
- Validate customer: The items ordered by the customer are validated.
- Sales Detail: Maintains the stock details after delivering the items to the customer.
Constraints
- The customer should wait until the trade contractor and other to analyze the product.
- After the distribution of the news about the product. The customer can take order and request of sales person to fill it.
- Finally the sales person delivers the order.
(III) Use case diagram
The functionality of a system can be described in a number of different use-cases, each of which represents a specific flow of events in a system. It is a graph of actors, a set of use-cases enclosed in a boundary, communication associations between the actors and the use-cases, and generalization among the use-cases.
The use cases used in this system are:
- Product details: Used for placing an order.
- Purchased details: Used for tracking items that have been ordered.
- Sales details: Used forgive the sales particulars about a item.
- Stock details: Used forgive the stock detail in a shop.
- Purchase the product: Used to provide bills for the customer.
- Supply the product: Used to give the order product to customer.
Actors
The actors used in this system are:
- Customer: The person who orders for the item.
- Shop keeper: The items ordered by the customer are validated.
- Company: Maintains the stock details after delivering the items to the customer.

Stock Maintenance Use Case Diagram
Activity Diagram
It shows organization and their dependence among the set of components. These diagrams are particularly useful in connection with workflow and in describing behavior that has a lot of parallel processing. An activity is a state of doing something: either a real-world process, or the execution of a software routine.

Class Diagram Description
- A class diagram describes the type of objects in system and various kinds of relationships that exists among them.
- Class diagrams and collaboration diagrams are alternate representations of object models.
The Stock maintenance system class diagram consists of seven classes:
- Purchase Details: One who takes orders for the product?
- Sales Details: The customer makes an order for the required products.
- Product Details: The items that are stored as stock.

.Class Diagram for stock maintenance
UML Interaction Diagrams
It is the combination of sequence and collaboration diagram. It is used to depict the flow of events in the system over a timeline. The interaction diagram is a dynamic model which shows show the system behaves during dynamic execution.
Sequence Diagram
A sequence diagram represents the sequence and interactions of a given use-case or scenario. Sequence diagrams can capture most of the information about the system. Most object-to-object interactions and operations are considered events, and events include signals, inputs, decisions, interrupts, transitions, and actions to perform users to devices.
An event also is considered to be any action by an object that sends information. The event line represents a message from one object to another, in which the “from” object is requesting an operation be performed by the “to” object. The “to” object performs the operation using a method that the class contains. It is also represented by the order in which things occur and how the objects in the system send messages to one another.

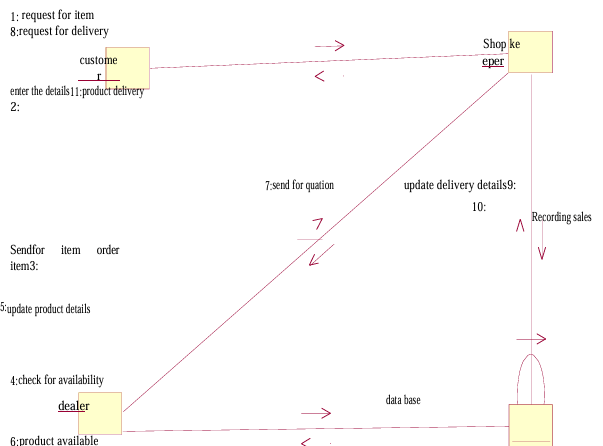
Collaboration Diagram
Collaboration diagram and sequence diagrams are alternate representations of an interaction. A collaboration diagram is an interaction diagram that shows the order of messages that implement an operation or a transaction. Collaboration diagram shows objects, their links, and their messages. They can also contain simple class instances and class utility instances.
During analysis, it indicates the semantics of the primary and secondary interactions. Design shows the semantics of mechanisms in the logical design of the system.

Deployment Diagram and Component Diagram
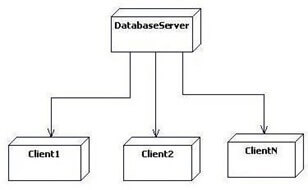
Deployment diagrams are used to visualize the topology of the physical components of a system where the software components are deployed.

