- 1. Implement the data link layer framing methods such as character, character stuffing and bit stuffing
- 2. Write a program to compute CRC code for the polynomials CRC-12, CRC-16 and CRC CCIP
- 3. Develop a simple data link layer that performs the flow control using the sliding window protocol, and loss recovery using the Go-Back-N mechanism.
- 4. Implement Dijsktra’s algorithm to compute the shortest path through a network
- 5. Take an example subnet of hosts and obtain a broadcast tree for the subnet
- 6. Implement distance vector routing algorithm for obtaining routing tables at each node
- 7. Implement data encryption and data decryption
- 8. Write a program for congestion control using Leaky bucket algorithm
- 9. Write a program for frame sorting technique used in buffers
-
10. Wireshark
i. Packet Capture Using Wire shark
ii. Starting Wire shark
iii. Viewing Captured Traffic
iv. Analysis and Statistics & Filters - 11. How to run Nmap scan
- 12. Operating System Detection using Nmap
AIM: Do the following using NS2 Simulator
- i. NS2 Simulator-Introduction
- ii. Simulate to Find the Number of Packets Dropped
- iii. Simulate to Find the Number of Packets Dropped by TCP/UDP
- iv. Simulate to Find the Number of Packets Dropped due to Congestion
- v. Simulate to Compare Data Rate& Throughput.
- vi. Simulate to Plot Congestion for Different Source/Destination
- vii. Simulate to Determine the Performance with respect to Transmission of Packets
Description:
i) NS2 Simulator-Introduction
- NS2 stands for Network Simulator Version
- It is an open-source event-driven simulator designed specifically for research in computer communication networks.
Features of NS2
- It is a discrete event simulator for networking
- It provides substantial support to simulate bunch of protocols like TCP, FTP, UDP, https and
- It simulates wired and wireless
- Uses TCL as its scripting
Network simulation is an important tool in developing, testing and evaluating network protocols. Simulation can be used without the target physical hardware, making it economical and practical for almost any scale of network topology and setup.
GETTING STARTED
Setting up the environment
A user using the NCTUns in single machine mode, needs to do the following steps before he/she starts the GUI program:
- Set up environment variables:
Before the user can run up the dispatcher, coordinator, or NCTUns GUI program he/she must set up the NCTUNSHOME environment variable.
- Start up the dispatcher on terminal
- Start up the coordinator on terminal
- Start up the nctunsclient on terminal
After the above steps are followed, the starting screen of NCTUns disappears and the user is presented with the working window as shown below: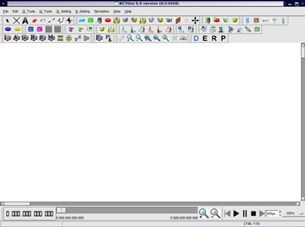
ii) Simulate a three node point to point network with a duplex link between them. Set the queue size and vary the bandwidth and find the number of packets dropped.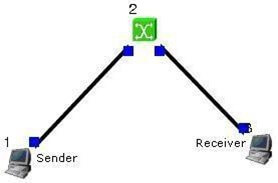
Step1: Drawing topology
- Select/click the HOST icon on the toolbar and click the left mouse button on the editor, to place a HOST1 on the editor.
Repeat the above procedure and place another host “HOST2” on the editor.
- Select/click the HUB icon on the toolbar and click the left mouse button on the editor, to place HUB1 on the editor.
- Click on the LINK icon on the toolbar and connect HOST1 to HUB1 and HUB1 toHOST2
- Click on the “E” icon on the toolbar to save the current topology
e.g: file1.tpl
(Look for the ******.tpl extension.)
NOTE: Changes cannot / (should not) be done after selecting the “E” icon.
Step2: Configuration
- Double click the left mouse button while cursor is on HOST1 to open the
- Select Add button on the HOST window to invoke the command window and provide the following command in the command textbox.
stg –u 1024 100 1.0.1.2
- Click OK button on the command window to exit and once again click on the OK button on the HOST window to exit.
- Double click the left mouse button while cursor is on HOST2 to open the
- Select Add button on the HOST window to invoke the command window and provide the following command in the command textbox.
rtg –u –w log1
- Click OK button on the command window to
- Click NODE EDITOR Button on the HOST window and select the MAC tab from the modal window that pops up.
- Select LOG STATISTICS and select checkboxes for Number of Drop Packet and Number of Collisions in the MAC window
- Click OK button on the MAC window to exit and once again click on the OK button on the HOST window to exit.
Note: To set QUEUE size
- Double click the left mouse button while cursor is on HOST2 to open the
- Click NODE EDITOR Button on the HOST window and select the FIFO tab from the modal window that pops up.
- Change Queue size (Default 50).
- Click OK button on the FIFO window to exit and once again click on the OK button on the HOST window to exit.
Step3: Simulate
- Click “R” icon on the tool bar
- Select Simulation in the menu bar and click/ select RUN in the drop down list to execute the simulation.
- venTo start playback select “►” icon located at the bottom right corner of the
- To view results, Open up new TERMINAL window, move to file1.resultsfolder and open collision and drop log files in separate TERMINAL window.
Changing configurations Change 1
- Open the above file,
- Do not change the topology or any other configuration,
- Select E icon on the toolbar
- Reduce the bandwidth at link2 by double clicking the left mouse button while cursor is on link2 .(Change bandwidth on both tabs Uplink/Downlink)
- Repeat Step3 (Simulate)
Change 2
- Open the above file,
- Remove HUB and replace it with
- Do not change anything in the configuration
- Repeat Step3(Simulate)
iii) Simulate a four node point to point network and connect the link as follows Apply a TCP agent between n0 to n3 and apply a UDP agent between n1 and Apply relevant applications over TCP and UDP agents changing the parameters and determine the number of packets sent by two agents.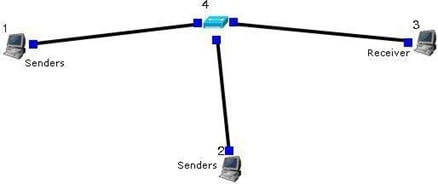
Step1: Drawing topology
- Select/click the HOST icon on the toolbar and click the left mouse button on the editor, to place a host on the editor.
Repeat the above procedure and place two other hosts “HOST2” and“HOST3” on the editor.
- Select/click the HUB (or SWITCH) icon on the toolbar and click the left mouse button on the editor, to place a HUB (or SWITCH) on the editor.
- Click on the LINK icon on the toolbar and connect HOST1 to HUB, HOST2 to HUB and HUB to HOST3
- Click on the “E” icon on the toolbar to save the current topology g: file2.tpl(Look for the ******.tpl extension.)
NOTE: Changes cannot / (should not) be done after selecting the “E” icon.
Step2: Configuration
- Double click the left mouse button while cursor is on HOST1 to open the
- Change simulation time from 0 to 20 for HOST1
- Select Add button on the HOST1 window to invoke the command window and provide the following command in the command textbox.
ttcp –t –u –s –p 8000 1.0.1.3
- Click OK button on the command window to exit
- Click NODE EDITOR Button on the HOST window and select the MAC tab from the modal window that pops up.
- Select LOG STATISTICS and select checkbox for output throughput in the MAC window
- Click OK button on the MAC window to exit and once again click on the OK button on the HOST window to exit.
- Double click the left mouse button while cursor is on HOST2 to open the
- Change simulation time from 21 to 40 for HOST2
- Select Add button on the HOST2 window to invoke the command window and provide the following command in the command textbox.
stg –u 1024 100 1.0.1.3
- Click OK button on the command window to exit
- Click NODE EDITOR Button on the HOST window and select the MAC tab from the modal window that pops up.
- Select LOG STATISTICS and select checkbox for output throughput in the MAC window
- Click OK button on the MAC window to exit and once again click on the OK button on the HOST window to exit.
- Double click the left mouse button while cursor is on HOST3 to open the
- Change simulation time from 0 to 20 for HOST3
- Select Add button on the HOST window to invoke the command window and provide the following command in the command textbox.
ttcp –r –u –s –p 8000
- Click OK button on the command window to
- Change simulation time from 21 to 40 for HOST3
- Also add the following command on HOST3 rtg –u –
w log1
- Click NODE EDITOR Button on the HOST window and select the MAC tab fromthe modal window that pops up.
- Select LOG STATISTICS and select checkbox for input and output throughput in the MAC window
- Click OK button on the MAC window to exit and once again click on the OK button on the HOST window to exit.
Step3: Simulate
- Click “R” icon on the tool bar
- Select Simulation in the menu bar and click/ select RUN in the drop down list to execute the simulation.
- To start playback select “►” icon located at the bottom right corner of the
- To view results, Open up new TERMINAL window, move to file2.resultsfolder and open input and output throughput log files in separate TERMINAL
iv) Simulate the transmission of ping messages over a network topology consisting of 6 nodes and find the number of packets dropped due to congestion.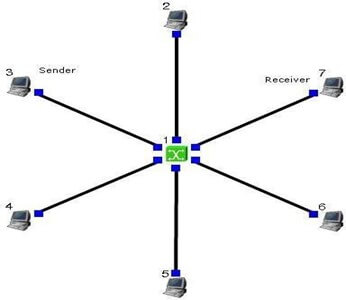
Step1: Drawing topology
- Select/click the SUBNET icon on the toolbar and click the left mouse button on the editor, to place a SUBNET on the editor.
- A pop up window appears requesting the number of nodes and radius for the subnet
Set number of nodes=6; Set radius of subnet >150
- Click on the “E” icon on the toolbar to save the current topology g: file4.tpl(Look for the ******.tpl extension.)
NOTE: Changes cannot / (should not) be done after selecting the “E” icon.
Step2: Configuration
- Make 5 HOST as sender and make 1 HOST as receiver and give the commands with particular port number
- Sender Commands
Sender 1 : stcp –p 21 –l 1024 1.0.1.1
Sender 2 : stcp –p 22 –l 1024 1.0.1.1
Sender 3 : stcp –p 23 –l 1024 1.0.1.1
Sender 4 : stcp –p 24 –l 1024 1.0.1.1
Sender 5 : stcp –p 25 –l 1024 1.0.1.1
Receiver Commands
rtcp –p 21 –l 1024
rtcp –p 22 –l 1024
rtcp –p 23 –l 1024
rtcp –p 24 –l 1024
rtcp –p 25 –l 1024
- For each sender HOST select the Out through put, Collision and Drop
- For receiver HOST select the In through tput, Collision and Drop
Step3: Simulate
- Click “R” icon on the tool bar
- Select Simulation in the menu bar and click/ select RUN in the dropdown list to execute the simulation.
- During simulation, double click the mouse button on any sender HOST, the HOST window pops up, select / click on command console button located at the bottom.
- A terminal window appears, type ping IP address of a receiver HOST in the subnet atthe command prompt.
- To view results, Open up new TERMINAL window, move to results folder and open drop and collision log files in separate TERMINAL window.
v) Simulate an ETHERNET LAN using n nodes (6-10), changeerror rate and data rate and compare throughput.
Step1: Drawing topology
- Select/click the HOST icon on the toolbar and click the left mouse button on the editor, to place HOST1 on the editor.
- Repeat the above procedure and place 5 other hosts “HOST2”, “HOST3”, “HOST4”, “HOST5”, and
“HOST6”on the editor.
- Select/click the HUB icon on the toolbar and click the left mouse button on the editor, to place HUB1 on the editor.
Repeat the above procedure and place another host “HUB2” on theeditor
- Click on the LINK icon on the toolbar and connect HOST1, HOST2 and HOST3 to HUB1, HOST4, HOST5 and HOST6to HUB2.
- Select/click the SWITCH icon on the toolbar and click the left mouse button on the editor, to place SWITCH1 on the editor.
- Click on the LINK icon on the toolbar and connect HUB1 to SWITCH1 and HUB2 to SWITCH1.
- Click on the “E” icon on the toolbar to save the current
topology e.g: file5.tpl
(Look for the ******.tpl extension.)
NOTE: Changes cannot / (should not) be done after selecting the “E” icon.
Step2: Configuration
- Double click the left mouse button while cursor is on HOST1to open the HOST window.
- Select Add button on the HOST window to invoke the command window and provide the following command in the command
ttcp –t –u –s –p 8001 1.0.1.4 (Split time from 0 to 10)
- Change error rate and data rate in the physical layer and select Out through put in MAC layer
- Click OK button on the command window to exit and once again click on the OK button on the HOST window to exit.
- Repeat this step at HOST 2 and HOST3 by changing port number& IP address of receiver. Change error rate and data rate.
ttcp –t –u –s –p 8002 1.0.1.5 (Split time from 11 to 20)
ttcp –t –u –s –p 8003 1.0.1.6 (Split time from 21 to 30)
- Double click the left mouse button while cursor is on HOST4to open the HOST window.
- Select Add button on the HOST window to invoke the command window and provide the following command in the command
ttcp –r –u –s –p 8001(Split time from 0 to 10)
- Change error rate and data rate in the physical layer and select IN through put in MAC layer
- Repeat this step at HOST 5 and HOST6, but use different commands. Change error rate and data rate.
ttcp –r –u –s –p 8002(Split time from 11 to 20)ttcp –r –u –s –p 8003(Split time from 21 to 30)
Step3: Simulate
- Click “R” icon on the tool bar
- Select Simulation in the menu bar and click/ select RUN in the dropdown list to execute the simulation.
- To start playback select “►” icon located at the bottom right corner of the editor. To view results, Open up new TERMINAL window, move to file5.results folder and open output throughput log files in separate TERMINAL window.
vi) Simulate an ETHERNET LAN using n nodes and set multiple traffic nodes and plot congestion window for different source/destination.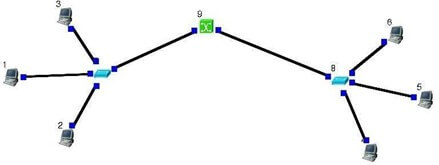
Step1: Drawing topology
- Select/click the HOST icon on the toolbar and click the left mouse button on the editor, to place HOST1 on the editor.
- Repeat the above procedure and place 3 other hosts “HOST2”, “HOST3”, “HOST4”, “HOST5”, and
“HOST6”on the editor.
- Select/click the HUB icon on the toolbar and click the left mouse button on the editor, to place HUB1 on the editor.
Repeat the above procedure and place another host “HUB2” on the editor
- Click on the LINK icon on the toolbar and connect HOST1, HOST2 and HOST3 to HUB1, HOST4, HOST5 and HOST6 to HUB2.
- Select/click the SWITCH icon on the toolbar and click the left mouse button on the editor, to place SWITCH1 the editor.
- Click on the LINK icon on the toolbar and connect HUB1 to SWITCH1 and HUB2 to SWITCH1.
- Click on the “E” icon on the toolbar to save the current topology g: file7.tpl (Look for the ******.tpl extension.)
NOTE: Changes cannot / (should not) be done after selecting the “E” icon.
Step2: Configuration
- Double click the left mouse button while cursor is on HOST1 to open the HOST window.
- Select Add button on the HOST window to invoke the command window and provide the following command in the command textbox.
ttcp –t –u –s –p 8001 1.0.1.4
- Click OK button on the command window to exit and once again click on the OK button on the HOST window to exit.
- Repeat this step at HOST 2 and HOST3 by changing port number &IP address of receiver. Change error rate and data rate.
ttcp –t –u –s –p 8002 1.0.1.5
ttcp –t –u –s –p 8003 1.0.1.6
- Select Out through put, Collision & Drop in MAC layer for all senders
- Double click the left mouse button while cursor is on HOST4 to open the HOST window.
- Select Add button on the HOST window to invoke the command window and provide the following command in the command textbox.
ttcp –r –u –s –p 8001
- Repeat this step at HOST 5 and HOST6, but use different commands. Change error rate and data rate.
ttcp –r –u –s –p 8002 ttcp –r –u –s –p 8003
- select In through put, Collision & Drop in MAC layer for all receivers
Step3: Simulate
- Click “R” icon on the tool bar
- Select Simulation in the menu bar and click/ select RUN in the dropdown list to execute the simulation.
- To start playback select “►” icon located at the bottom right corner of the
- To plot congestion window select Tools in the menu bar and select PLOT GRAPH in the drop down list.
- In the Graph window, select File->OPEN, move to results folder and the drop and collision log file.
- To open another Graph window, Select File->New tab on the dropdown list to open up to a maximum of 6 windows
- To view results, Open up new TERMINAL window, move to results folder and open input and output throughput log files in separate TERMINAL window.
vii) Simulate simple BSS and with transmitting nodes in wireless LAN by simulation and determine the performance with respect to transmission of packets.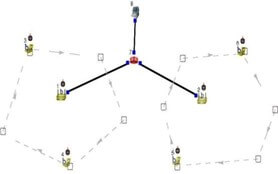
Step1: Drawing topology
- Select/click the HOST icon on the toolbar and click the left mouse button on the editor, to place HOST1 on the editor.
- Select/click the ROUTER icon on the toolbar and click the left mouse button on the
editor, to place ROUTER1 on the editor.
- Select/click the WIRELESS ACCESS POINT(802.11b) icon on the toolbar and click the left mouse button on the editor, to place ACCESS POINT 1 on the editor.
Repeat this procedure and place ACCESS POINT 2 on the editor.
- Select/click the MOBILE NODE (infrastructure mode) icon on the toolbar and click the left mouse button on the editor, to place MOBILE NODE 1 on the Repeat this procedure and place MOBILE NODE 2, MOBILE NODE3 and MOBILE NODE 4 on the editor.
- Click on the LINK icon on the toolbar and connect ACCESS POINT1 to ROUTER1 and ACCESS POINT2 to ROUTER1
- Click on the “Create a moving path” icon on the toolbar and draw moving path across MOBILE NODE 1 and 2, Repeat for MOBILE NODE 3and 4(Accept the default speed value 10 and close the window, Click the right mouse button to terminate the path).
To create Subnet
- Select wireless subnet icon in the toolbar now select MOBILE NODE1, MOBILE NODE2 and ACCESS POINT1 by clicking on left mouse button, and clicking right mouse button will create a subnet.
- Repeat the above step for MOBILE NODE3, MOBILE NODE4 and ACCESS POINT2.
- Click on the “E” icon on the toolbar to save the current topology g:
file8.tpl
(Look for the ******.tpl extension.)
NOTE: Changes cannot / (should not) be done after selecting the “E” icon.
Step2: Configuration
- Double click the left mouse button while cursor is on HOST1 to open the HOST
- Select Add button on the HOST window to invoke the command window and provide the following command in the command textbox.
ttcp –r –u –s –p 8001
- Click OK button on the command window to exit
- Repeat this step and add the following commands at HOST1ttcp – r –u –s –p 8002
ttcp –r –u –s –p 8003ttcp
–r –u –s –p 8004 ttcp –r
–u –s –p 8005
- Click NODE EDITOR Button on the HOST1 window and select the MAC tab from the modal window that pops up.
- Select LOG STATISTICS and select checkbox for Input throughput in the MAC window
- Click OK button on the MAC window to exit and once again click on the OK button on the HOST window to exit.
- Double click the left mouse button while cursor is on MOBILE NODE 1 toopen the MOBILE NODE window.
- Select Application tab and select Add button to invoke the command window and provide the following command in the command textbox.
ttcp –t –u –s –p 8001 1.0.2.2 (host’s ip address)
- Click NODE EDITOR Button on the MOBILE NODE1 window and select the MAC tab from the nodal window that pops up.
- Select LOG STATISTICS and select checkbox for Output throughput in the MAC window
- Click OK button on the MAC window to exit and once again click on the OK button on the MOBILE NODE1 window to exit.
- Repeat the above steps (step 8 to step12) for the MOBILE NODE2,3 and4 and add the following commands at
MOBILE NODE2:- ttcp –t –u –s –p 8002 1.0.2.2MOBILE NODE 3:- ttcp –t–u –s –p 8003 1.0.2.2 MOBILE NODE4:- ttcp –t –u –s –p 8004 1.0.2.2
- Double click the left mouse button while cursor is on ROTER1 to open the ROUTER window.
- Click NODE EDITOR Button on the ROUTER1 window and you can see three stacks. two stacks for two ACCESS POINTS and another stack for HOST1 which is connected to the ROUTER1.
- Select the MAC tab of ACCESS POINT1 and Select LOG STATISTICS and select checkbox for Input throughput in the MAC window. Click OK button on the MAC window to exit.
- Select the MAC tab of ACCESS POINT2 and Select LOG STATISTICS and select checkbox for Input throughput in the MAC window. Click OK button on the MAC window to exit.
- Select the MAC tab of HOST1 and Select LOG STATISTICS and select checkbox for Output throughput in the MAC Click OK button on the MAC window to exit.
- Add the following command for router
ttcp –t –u –s –p 8005 1.0.2.2 (host’s ip address)
Step3: Simulate
I. | Click “R” icon on the tool bar |
II. | Select Simulation in the menu bar and click/ select RUN in the |
dropdown list to execute the simulation. |
- To start playback select “►” icon located at the bottom right corner of the
- MOBILE NODE’s start moving across the paths already
