Aim: Write a Python program to implement Simple Linear Regression
Linear Regression Example:
# Importing the dataset
import numpy as np
import pandas as pd
import matplotlib.pyplot as plt
dataset = pd.read_csv('Salary_Data.csv')
dataset.head()
# Data preprocessing
X = dataset.iloc[:, :-1].values # Independent variable array
y = dataset.iloc[:, 1].values # Dependent variable vector
# Splitting the dataset
from sklearn.model_selection import train_test_split
X_train, X_test, y_train, y_test = train_test_split(X, y, test_size=1/3, random_state=0)
# Fitting the regression model
from sklearn.linear_model import LinearRegression
regressor = LinearRegression()
regressor.fit(X_train, y_train) # Actually produces the linear equation for the data
# Predicting the test set results
y_pred = regressor.predict(X_test)
y_pred
y_test
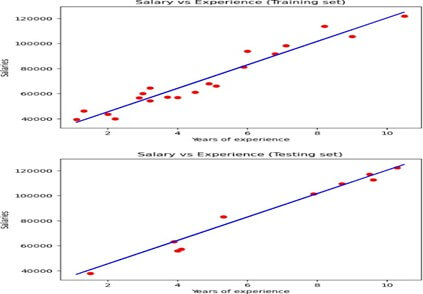
# Visualizing the results: Training set
plt.scatter(X_train, y_train, color='red') # Plotting the observation points
plt.plot(X_train, regressor.predict(X_train), color='blue') # Plotting the regression line
plt.title("Salary vs Experience (Training set)") # Adding a title to the graph
plt.xlabel("Years of Experience") # Labeling x-axis
plt.ylabel("Salaries") # Labeling y-axis
plt.show() # Display the graph
# Visualizing the results: Testing set
plt.scatter(X_test, y_test, color='red')
plt.plot(X_train, regressor.predict(X_train), color='blue') # Plotting the regression line
plt.title("Salary vs Experience (Testing set)")
plt.xlabel("Years of Experience")
plt.ylabel("Salaries")
plt.show()
Output:
Sample Viva Questions :
1.What is linear regression, and how does it work?
Linear regression is a statistical method used to model the relationship between a dependent variable and one or more independent variables. It is called “linear” because the model assumes a linear relationship between the dependent and independent variables.
2. What are the assumptions of a linear regression model?
The assumptions of a linear regression model are:
- The relationship between the independent and dependent variables is
- The residuals, or errors, are normally distributed with a mean of zero and a constant
- The independent variables are not correlated with each other (i.e. they are not collinear).
- The residuals are independent of each other (i.e. they are not autocorrelated).
- The model includes all the relevant independent variables needed to accurately predict the dependent variable.
3. What are outliers?
A value that is significantly different from the mean or the median is considered to be an outlier in statistics. There is a possibility of erroneous results due to measurement errors. There is also the possibility of an experimental error being indicated.
4. What are the common types of errors in linear regression analysis?
There are several types of errors that can occur in linear regression analysis. Some of the most common include:
Overestimating or underestimating the relationship between the variables: This can happen if the model is too complex or if important variables are left out of the model.
Incorrect functional form: The chosen functional form (e.g. linear, log-linear, etc.) may not accurately represent the relationship between the variables.
Non-linearity of the residuals: The residuals (the difference between the observed values and the predicted values) should be randomly distributed around zero if the model is correct. If the residuals exhibit non-linear patterns, it may indicate that the chosen model is not the best fit for the data.
Multicollinearity: This occurs when two or more predictor variables in a model are highly correlated, which can cause unstable coefficient estimates and make it difficult to interpret the results.
Outliers: Outliers, or extreme values in the data, can have a significant impact on the fitted values and coefficients in a linear regression model. It is important to identify and address any potential outliers in the data before fitting a model.
5. What is the difference between biased and unbiased estimates in linear regression?
Biased estimates in linear regression refer to estimates that consistently over- or underestimate the true population parameter. This can occur due to various factors, such as missing information or incorrect assumptions about the data. Unbiased estimates, on the other hand, accurately reflect the true population parameter, without any systematic over- or underestimation.