i) Pandas
Pandas is an open-source Python library that provides high-performance, easy-to-use data structure, and data analysis tools for the Python programming language.
Python with pandas is used in a wide range of fields, including academics, retail, finance, economics, statistics, analytics, and many others.
Python pandas is well suited for different kinds of data, such as:
- Ordered and unordered time series data
- Unlabeled data
- Any other form of observational or statistical data sets
Pandas is a powerful and versatile library that simplifies tasks of data manipulation in Python . Pandas is built on top of the NumPy library and is particularly well-suited for working with tabular data, such as spreadsheets or SQL tables. Its versatility and ease of use make it an essential tool for data analysts, scientists, and engineers working with structured data in Python.
Installing Pandas
The first step of working in pandas is to ensure whether it is installed in the system or not. If not then we need to install it in our system using the pip command. Type the cmd command in the search box and locate the folder using the cd command
where python-pip file has been installed. After locating it, type the command:
pip install pandas
For more reference take a look at this article on installing pandas follows.
Importing Pandas
After the pandas have been installed into the system, you need to import the library. This module is generally imported as follows:
import pandas as pd
What can you do using Pandas?
Pandas are generally used for data science but have you wondered why? This is because pandas are used in conjunction with other libraries that are used for data science. It is built on the top of the NumPy library which means that a lot of structures of NumPy are used or replicated in Pandas. The data produced by Pandas are often used as input for plotting functions of Matplotlib, statistical analysis in SciPy, and machine learning algorithms in Scikit-learn. Here is a list of things that we can do using Pandas.
- Data set cleaning, merging, and
- Easy handling of missing data (represented as NaN) in floating point as well as non- floating point data.
- Columns can be inserted and deleted from DataFrame and higher dimensional
- Powerful group by functionality for performing split-apply-combine operations on data
- Data Visulaization
Getting Started with Pandas Installing Pandas
The first step of working in pandas is to ensure whether it is installed in the system or not. If not then we need to install it in our system using the pip command. Type the cmd command in the search box and locate the folder using the cd command where python- pip file has been installed. After locating it, type the command:
pip install pandas
For more reference take a look at this article on installing pandas follows. Importing Pandas
After the pandas have been installed into the system, you need to import the library. This module is generally imported as follows:
import pandas as pd
Here, pd is referred to as an alias to the Pandas. However, it is not necessary to import the library using the alias, it just helps in writing less amount code every time a method or property is called.
Pandas Data Structures
Pandas generally provide two data structures for manipulating data, They are:
- Series
- DataFrame
Pandas Series
A Pandas Series is a one-dimensional labeled array capable of holding data of any type (integer, string, float, python objects, etc.). The axis labels are collectively called indexes. Pandas Series is nothing but a column in an Excel sheet. Labels need not be unique but must be a hashable type. The object supports both integer and label-based indexing and provides a host of methods for performing operations involving the index.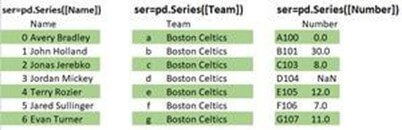
Creating a Series
In the real world, a Pandas Series will be created by loading the datasets from existing storage, storage can be SQL Database, CSV file, or an Excel file. Pandas Series can be created from lists, dictionaries, and from scalar values, etc.
ii) Matplotlib
Neuroscientist John D. Hunter began developing matplotlib in 2003, mainly inspired by the emulation of Mathworks MATLAB software teams. Matplotlib is today a whole product of the community: it is developed and supported by many people. John talked about the evolution of matplotlib at the SciPy conference in 2012. Learning matplotlib at times can be a difficult process. The problem is not the lack of documentation (which is very extensive, by the way). Difficulties may arise with the following:
- The size of the library is huge in itself, about 70,000 lines of code
- Matplotlib contains several different interfaces (ways to build a figure) and can interact with a large number of backends. (The backends are responsible for how in fact the diagrams will be displayed, not only for the internal structure)
- Despite the vastness, some of the matplotlib’s own documentation is seriously outdated. The library is still evolving, and many old examples on the web may include 70% less code than in their current version.
Understanding that matplotlib roots grow from MATLAB helps explain the existence of pylab. pylab is a module inside the matplotlib library that has been built in to emulate the overall MATLAB style. It exists only for introducing a number of class functions from NumPy and matplotlib into the namespace, which simplifies the transition of MATLAB users who did not encounter the need for import statements. Former MATLAB users love its functionality, because with from pylab import * they can simply call plot() or array() directly, just like they did in MATLAB.
Key features of Matplotlib
One of the business cards of matplotlib is the hierarchy of its objects. If you have already worked with the matplotlib introductory manual, you may have already called something like plt.plot ([1, 2, 3]). This one line indicates that the graph is actually a hierarchy of Python objects. By “hierarchy” we mean that each chart is based on a tree-like structure of matplotlib objects.
The Figure object is the most important external container for matplotlib graphics, which can include several Axes objects. The reason for the difficulty in understanding may be
the name: Axes (axes), in fact, turn into what we mean by an individual graph or chart (rather than the plural “axis”, as you might expect).
You can think of the Figure object as a box-like container containing one or more Axes objects (real graphs). Below Axes objects, in a hierarchical order, are smaller objects such as individual lines, elevations, legends, and text boxes. Almost every “element” of a diagram is its own manipulated Python object, right up to labels and markers. An example chart on the matplot is located below.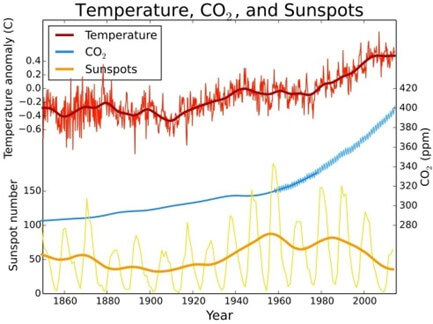
Matplotlib is a flexible, easily configurable package that, along with NumPy, SciPy, and IPython, provides features similar to MATLAB. The package currently works with several graphics libraries, including wxWindows and PyGTK.
Python code example for plotting
The Python code itself is quite simple and straightforward. Here’s an example of a simple plot: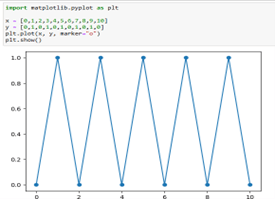
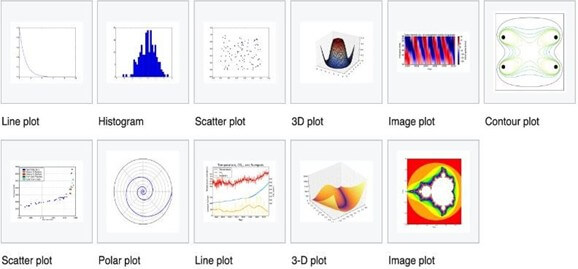
Types of graphs and charts
The package supports many types of graphs and charts:
- Charts (line plot)
- Scatter plot
- Bar charts and histograms
- Pie Chart
- Chart trunk (stem plot)
- Contour plots
- Gradient Fields (quiver)
- Spectrograms
The user can specify the coordinate axis, grid, add labels and explanations, use a logarithmic scale or polar coordinates
Simple 3D graphics can be built using the mplot3d toolkit. There are other toolkits: for mapping, for working with Excel, utilities for GTK and others. With Matplotlib, you can make animated images.
Matplotlib can be technically and syntactically complex. To create a ready-made diagram, it can take half an hour to google search alone and combine all this hash to fine-tune the graph. However, understanding how matplotlib interfaces interact with each other is an investment that can pay off.