Break Even Analysis
BEP analysis is also called as CVP analysis. The BEP can be defined as that level of sales at which total revenues equals total costs and the net income is equal to zero. This is also known as no-profit no-loss point. Break-even analysis refers to the analysis of costs and their possible impact on revenues and the volume of the firm. Hence, it is also called the cost-volume-profit (CVP) analysis. A firm is said to attain the BEP when its total revenue is equal to total cost (TR=TC).
The main objective of the Break Even Analysis is not only to spot the BEP but also to develop an understanding of the relationships of cost, volume, and price within a company’s practical range of operations.
Assumptions of Break-Even Analysis
- All costs are divided into fixed and variable.
- Fixed costs remain constant whereas variable costs vary.
- Selling price remains constant.
- There will be no change in the operating efficiency.
- Fixed Cost (FC): Fixed costs remain fixed in the short-run. These costs must be borne by the firm even when there is no production. Example: Rent, Insurance, Depreciation, permanent employees’ salaries, etc. Fixed cost per unit varies.
- Variable Costs (VC): The costs which vary in direct proportion to the production/sales volume are called variable costs. Variable cost per unit is fixed. Examples include cost of direct material, cost of direct labor, direct expenses, operating supplies such as oil, grease, etc.
- Total Cost (TC): The total of fixed cost and variable costs. TC = FC + VC.
- Total Revenue: The sales amount of goods sold in the market (Selling Price per unit × Number of units sold).
- Contribution: The excess of sales revenue over variable cost (C = S – V).
- P/V Ratio (Profit/Volume Ratio): The ratio between the contribution and sales.
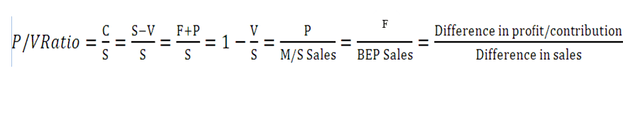
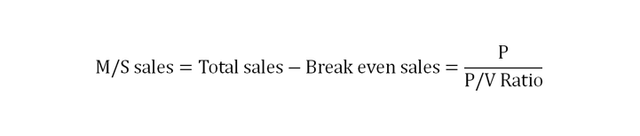
- Margin of Safety Sales (M/S Sales): The excess of actual total sales over break-even sales.
- Break-even Point (BEP): The point where total revenue is just equal to the total cost is called Break-even point. At break-even point, there is no profit or no loss to the business. Break-even point can be calculated in units as well as in sales.

BEP (in units) = Fixed Cost / (Selling Price per unit – Variable Cost per unit)
BEP (in sales) = Fixed Cost / Contribution per unit
Where Contribution per unit = Selling Price per unit – Variable Cost per unit
Important Notes:
- At BEP sales, Total sales = Total cost (F + V). At this stage, total contribution (S – V) is equal to fixed cost. So, there is no profit or no loss. Hence, C = F.
- Below the BEP sales, total contribution is less than total fixed cost. Hence, C < F.
- Beyond BEP sales (M/S sales), since fixed cost is recovered at BEP sales, C = P.
- M/S sales = Total sales – BEP sales.
Understanding the Break-even Graph
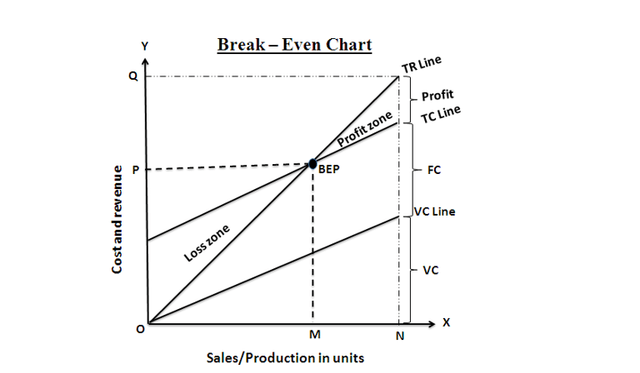
- In the graph:
- The variable cost line increases with the volume of production and sales.
- The total cost line, parallel to the variable cost line, is derived by adding total fixed costs to the total variable costs.
- The total revenue line (TR) starts from point (0) and increases with the volume of production or sales, intersecting the total cost line at the BEP.
- To the right of the BEP is the profit zone and to the left is the loss zone.
- A perpendicular from the BEP to the horizontal axis at point ‘M’ shows ‘OM’ as the quantity produced at ‘OP’ cost at BEP.
- The angle formed by the point of intersection of total revenue and total cost lines at BEP is called the angle of incidence. The greater the angle of incidence, the higher is the magnitude of profit once the fixed costs are covered.
- Margin of Safety (MN) refers to the excess of production or sales over and above the BEP. The margin of safety is the difference between ON and OM (ON – OM = MN).
Significance Of Break-Even Analysis
– To ascertain the profit on a particular level of sales volume or a given capacity of production.
– To calculate sales required to earn a particular desired level of profit.
– To compare the product lines, sales area, method of sale for an individual company.
– To compare the efficiency of different firms.
– To decide whether to add a particular product to the existing product line or drop one from it.
– To decide to „make or buy‟ a given component or spare part.
– To decide what promotion mix will yield optimum sales.
– To assess the impact of changes in fixed cost, variable cost, or selling price on BEP and profits during a given period.
– Break-even point is based on fixed cost, variable cost, and total revenue. A change in one variable is going to affect the BEP.
– All costs cannot be classified into fixed and variable costs; we have semi-variable costs also.
– In the case of a multi-product firm, a single chart cannot be of any use. Series of charts have to be made use of.
– It is based on the fixed cost concept and hence holds good only in the short run.
– Total cost and total revenue lines are not always straight as shown in the figure. The quantity and price discounts are the usual phenomena affecting the total revenue line.
– Where the business conditions are volatile, BEP cannot give stable results.
Problems and Solutions:
A firm has a fixed cost of Rs. 10,000, selling price per unit is Rs. 5, and variable cost per unit is Rs. 3.
a. Determine break-even point in terms of volume and also sales value.
b. Calculate the margin of safety considering that the actual production is 8000 units.
Solution:
a. Break-even point (in units):
BEP (in units) = Fixed Cost / Contribution per unit
Given: Selling price per unit (S) = Rs. 5, Variable cost per unit (V) = Rs. 3
Contribution per unit = S – V = 5 – 3 = Rs. 2
BEP (in units) = 10000 / 2 = 5000 units
b. Break-even point (in sales):
BEP (in sales) = Fixed Cost / P/V Ratio
P/V Ratio = (Contribution per unit / Selling price per unit) * 100
P/V Ratio = (2 / 5) * 100 = 40%
BEP (in sales) = 10000 / 40% = Rs. 25,000
2. A high-tech rail can carry a maximum of 36,000 passengers per annum at a fare of Rs. 400. The variable cost per passenger is Rs. 150 while the fixed costs are Rs. 25,00,000 per year.
a. Find the break-even point in terms of number of passengers.
b. Find the break-even point in terms of fare collections.
Solution:
a. Break-even point (in number of passengers):
BEP (in number of passengers) = Fixed Costs / Contribution per passenger
Given: Selling price per passenger (S) = Rs. 400, Variable cost per passenger (V) = Rs. 150
Contribution per passenger = S – V = 400 – 150 = Rs. 250
BEP (in number of passengers) = 2500000 / 250 = 10000 passengers
b. Break-even point (in fare collections):
BEP (in fare collections) = Fixed Costs / P/V Ratio
P/V Ratio = (Contribution per passenger / Selling price per passenger) * 100
P/V Ratio = (250 / 400) * 100 = 62.50%
BEP (in fare collections) = 2500000 / 62.50% = Rs. 40,00,000
Problem and Solution:
Srikanth Enterprises deals in the supply of hardware parts of computers. The following cost data is available for two successive periods:
Year I (Rs.) Year II (Rs.) Sales 50,000 1,20,000 Fixed costs 10,000 20,000 Variable cost 30,000 60,000 Determine:
- Break-even point in terms of sales for both years.
- Margin of safety for both years.
Solution:
a. Break-even point (in sales):
Year I:
BEP (in sales) = Fixed Costs / P/V Ratio
P/V Ratio = (Contribution / Sales) * 100
Contribution = Sales – Variable cost = 50000 – 30000 = Rs. 20000
P/V Ratio = (20000 / 50000) * 100 = 40%
BEP (in sales) = 10000 / 40% = Rs. 25,000
Year II:
BEP (in sales) = Fixed Costs / P/V Ratio
Contribution = Sales – Variable cost = 120000 – 60000 = Rs. 60000
P/V Ratio = (60000 / 120000) * 100 = 50%
BEP (in sales) = 20000 / 50% = Rs. 40,000
b. Margin of safety:
Year I:
Margin of safety = Actual Sales – BEP Sales
Margin of safety = 50000 – 25000 = Rs. 25,000
Year II:
Margin of safety = Actual Sales – BEP Sales
Margin of safety = 120000 – 40000 = Rs. 80,000