Aim: Implementation of Multiple Linear Regression for House Price Prediction using sklearn
Real Estate Price Prediction Using Linear Regression:
# Importing modules and packages
import pandas as pd
import numpy as np
import matplotlib.pyplot as plt
import seaborn as sns
from sklearn.model_selection import train_test_split
from sklearn.linear_model import LinearRegression
from sklearn.metrics import mean_squared_error, mean_absolute_error

# Importing the dataset
df = pd.read_csv('Real-estate1.csv')
df.drop('No', inplace=True, axis=1)  # Dropping unnecessary column
print(df.head())  # Display the first few rows of the dataset
print(df.columns)  # Display column names

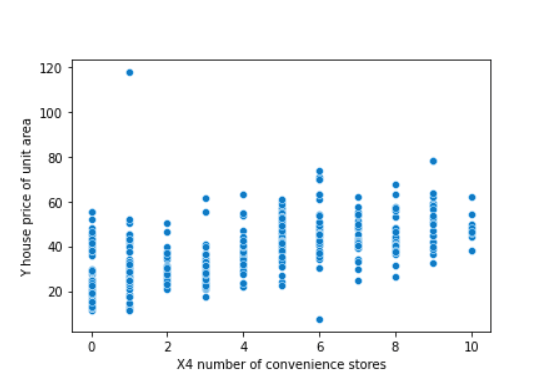
# Plotting a scatterplot
sns.scatterplot(
    x='X4 number of convenience stores',
    y='Y house price of unit area',
    data=df
)
plt.title('Convenience Stores vs House Price')
plt.xlabel('Number of Convenience Stores')
plt.ylabel('House Price per Unit Area')
plt.show()

# Creating feature and target variables
X = df.drop('Y house price of unit area', axis=1)  # Feature variables
y = df['Y house price of unit area']  # Target variable
print(X.head())  # Display the first few rows of features
print(y.head())  # Display the first few rows of the target variable

# Splitting the dataset into training and testing sets
X_train, X_test, y_train, y_test = train_test_split(
    X, y, test_size=0.3, random_state=101
)

# Creating and fitting the regression model
model = LinearRegression()
model.fit(X_train, y_train)

# Making predictions
predictions = model.predict(X_test)

# Model evaluation
print('Mean Squared Error:', mean_squared_error(y_test, predictions))
print('Mean Absolute Error:', mean_absolute_error(y_test, predictions))
Output:
X1 transaction date X2 house age … X6 longitude Y house price of unit area
0 2012.917 32.0 … 121.54024 37.9
1 2012.917 19.5 … 121.53951 42.2
2 2013.583 13.3 … 121.54391 47.3
3 2013.500 13.3 … 121.54391 54.8
4 2012.833 5.0 … 121.54245 43.1
[5 rows x 7 columns]
Index([‘X1 transaction date’, ‘X2 house age’,
‘X3 distance to the nearest MRT station’,
‘X4 number of convenience stores’, ‘X5 latitude’, ‘X6 longitude’,
‘Y house price of unit area’],
dtype=’object’)
X1 transaction date X2 house age … X5 latitude X6 longitude
0 2012.917 32.0 … 24.98298 121.54024
1 2012.917 19.5 … 24.98034 121.53951
2 2013.583 13.3 … 24.98746 121.54391
3 2013.500 13.3 … 24.98746 121.54391
4 2012.833 5.0 … 24.97937 121.54245
.. … … … … …
409 2013.000 13.7 … 24.94155 121.50381
410 2012.667 5.6 … 24.97433 121.54310
411 2013.250 18.8 … 24.97923 121.53986
412 2013.000 8.1 … 24.96674 121.54067
413 2013.500 6.5 … 24.97433 121.54310
[414 rows x 6 columns]
0 37.9
1 42.2
2 47.3
3 54.8
4 43.1
…
409 15.4
410 50.0
411 40.6
412 52.5
413 63.9
Name: Y house price of unit area, Length: 414, dtype: float64
mean_squared_error : 46.21179783493418
mean_absolute_error : 5.392293684756571
Sample Viva Questions:
1.What Is Multiple Linear Regression (MLR)?
Multiple linear regression (MLR) is used to determine a mathematical relationship among several random variables.1 In other terms, MLR examines how multiple independent variables are related to one dependent variable.
2. What are the different visualization libraries in python for multiple linear regression?
Some of the commonly used visualization libraries for Multiple Linear Regression in Python are Matplotlib, Seaborn, Plotly, and ggplot. These libraries can be used to create a range of plots (like the scatter plot) and charts, to better understand relationships between variables, detect patterns and trends, and communicate results to stakeholders.
3. What is the difference between linear and multiple regression?
A Linear regression is a statistical method used to analyze the relationship between two continuous variables. On the other hand, multiple regression is a statistical method used to analyze the relationship between one dependent variable and two or more independent variables.
4. How to use scikit-learn linear regression in Python?
Follow the steps below to use scikit-learn’s linear regression in Python:
- First, import the LinearRegression module from scikit-learn’s linear_model
- Then, create an instance of the LinearRegression object and fit your data to the model using the fit() method.
- Once the model is trained, you can make predictions on new data using the predict()
- Finally, you can evaluate the performance of the model using various metrics, such as R-squared, mean squared error, or mean absolute error.
