Behavioral model
Introduction
Behavioral models are used to describe the overall behavior of the system. This model describes the internal processing of a system. It specifies what processes take place and how one process is related with another within the boundary of the systems.
Definition
Behavior model: “The internal functioning and inter-relationship between various levels and processes of the proposed systems”
There are two types of behavioral models:
Dataflow model: Which model the data processing in the system
State machine model: Which model how the system reacts to events
Dataflow model
The flow of data in a system or process is represented by a Data Flow Diagram (DFD). It also gives insight into the inputs and outputs of each entity and the process itself. Data Flow Diagram (DFD) does not have a control flow and no loops or decision rules are present. Specific operations, depending on the type of data, can be explained by a flowchart. It is a graphical tool, useful for communicating with users, managers and other personnel. It is useful for analyzing existing as well as proposed systems.
It provides an overview of
What data the system processes
What transformations are performed
What data are stored
What results are produced, etc.
Data Flow Diagram can be represented in several ways. The Data Flow Diagram (DFD) belongs to structured-analysis modeling tools. Data Flow diagrams are very popular because they help us to visualize the major steps and data involved in software-system processes.
Characteristics of Data Flow Diagram (DFD)
Graphical representation: Data Flow Diagram (DFD) uses different symbols and notations to represent data flow within the system. That simplifies the complex model.
Problem analysis: Data Flow Diagrams (DFDs) are very useful in understanding a system and can be effectively used during analysis. DFDs are quite general and are not limited to problem analysis for software requirements specification.
Abstraction: DFD provides abstraction to complex models, i.e., DFD hides unnecessary implementation details and shows only the flow of data and processes within the information system.
Hierarchy: DFD provides a hierarchy of a system. High-level diagram (0-level) provides an overview of the entire system, while lower-level diagrams like 1-level DFD and beyond provide detailed data flow of individual processes.
Data flow: The primary objective of DFD is to visualize the data flow between external entities, processes, and data stores. Data Flow is represented by an arrow symbol.
Ease of understanding: DFD can be easily understood by both technical and non-technical stakeholders.
Modularity: Modularity can be achieved using DFD as it breaks the complex system into smaller modules or processes. This provides easy analysis and design of a system.
Types of Data Flow Diagram (DFD)
Logical Data Flow Diagram
Physical Data Flow Diagram
Logical Data Flow Diagram (DFD)
Logical Data Flow Diagram mainly focuses on the system process. It illustrates how data flows in the system. Logical DFD mainly focuses on high-level processes and data flow without diving deep into technical implementation details. Logical DFD is used in various organizations for the smooth running of systems. Like in a banking software system, it is used to describe how data is moved from one entity to another.
Physical Data Flow Diagram
Physical Data Flow Diagram shows how the data flow is actually implemented in the system. In the Physical DFD, we include additional details such as data storage, data transmission, and specific technology or system components. Physical DFD is more specific and close to implementation.
Levels of DFD
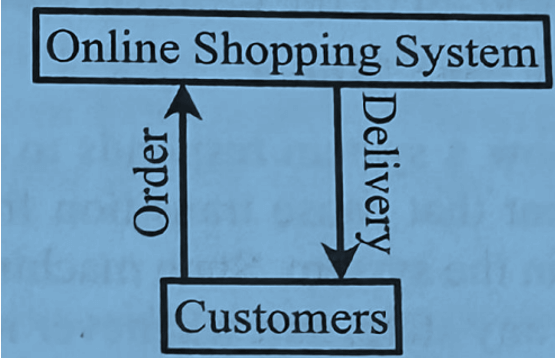
Level 0 – Highest abstraction level DFD is known as Level 0 DFD, which depicts the entire information system as one diagram concealing all the underlying details. Level 0 DFDs are also known as context-level DFDs.
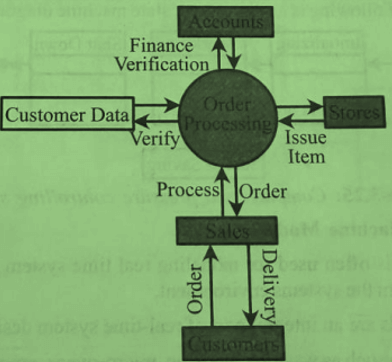
Level 1 – The Level 0 DFD is broken down into more specific Level 1 DFD. It depicts basic modules in the system and the flow of data among various modules. It also mentions basic processes and sources of information.
Level 2 – At this level, DFD shows how data flows inside the modules mentioned in Level 1.
Higher-level DFDs can be transformed into more specific lower-level DFDs with a deeper level of understanding unless the desired level of specification is achieved.
Advantages of Data Flow Diagram (DFD)
It helps us to understand the functioning and the limits of a system.
It is a graphical representation which is very easy to understand as it helps visualize contents.
DFDs represent detailed and well-explained diagrams of system components.
It is used as a part of the system documentation file.
DFDs can be understood by both technical and non-technical people because they are very easy to understand.
Disadvantages of Data Flow Diagram (DFD)
At times, DFDs can confuse the programmers regarding the system.
DFDs take a long time to be generated, and many times due to this reason analysts are denied permission to work on it.
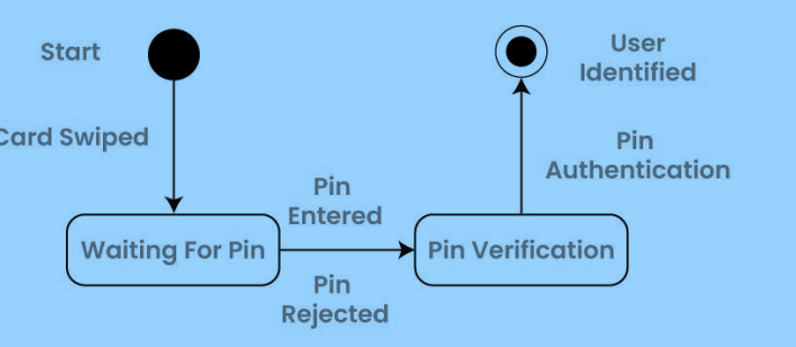
State machine model
A State Machine Diagram is used to represent the condition of the system or part of the system at finite instances of time. It’s a behavioral diagram and it represents the behavior using finite state transitions.
Advantages of state chart machines
Clarity and readability
Better system organization
Easier debugging and testing
Modularity and reusability
Ensures deterministic behavior
Useful in real-time and embedded systems
Disadvantages of state chart machines
Complexity for large systems
Difficult to scale
Performance overhead
Requires good initial design
Not always the best fit.